AboutUs
Reflections on 9+ years
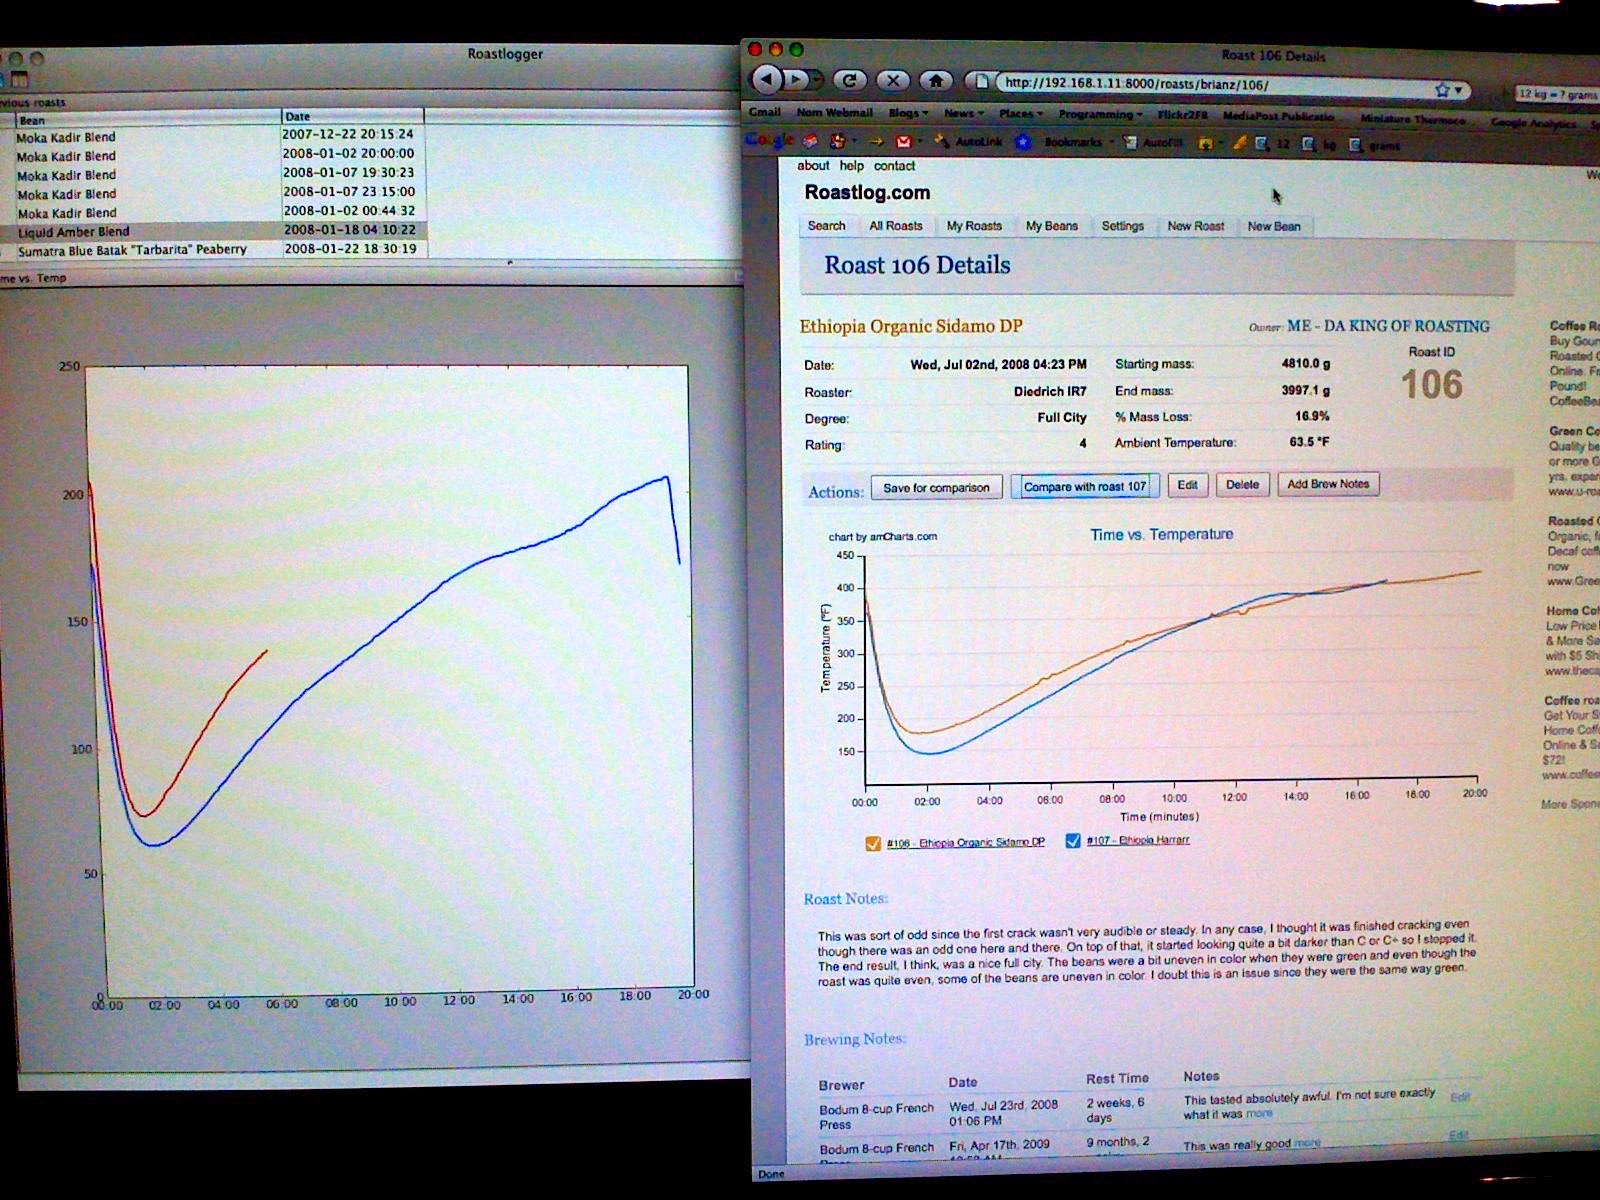
Today the RoastLog team is flying out to Seattle for the annual SCA Conference (note, it’s hard not to type “SCAA”). This years marks the eighth year that we have officially exhibited at the conference, and the ninth one if you count our appearance in Atlanta. In 2009 Linsey and I crashed shared a booth at SCAA Atlanta with a friend and setup shop with two Data Bridge prototypes and a couple of laptops. Our goal there was simply to Read more…