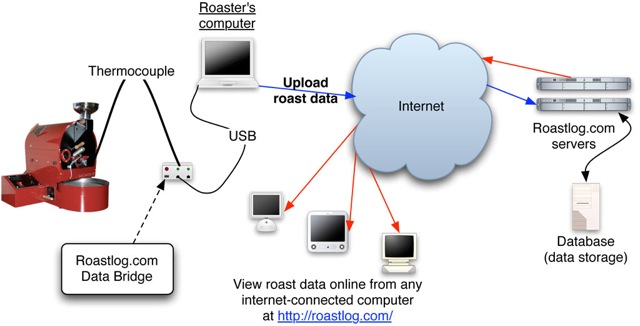
One thing we haven’t done a very good job of yet is actually describing how RoastLog works, and what it’s capable of. Let’s look at a diagram.
There are three pieces to the RoastLog system:
- The Data Bridge
- The RoastLogger desktop application (installed on your computer, for Mac or PC)
- The RoastLog website
I’ll describe our architecture with an analogy. Nowadays, we’re used to using email services such as Gmail and Yahoo! mail. You can sit down in front of any computer connected to the internet to check your email, or send mail to your friends. This is “software as a service”. Basically, these sites are providing software to you, but in a way which is more service-oriented, and opposed to product-oriented where you buy a CD and install their program on your computer. The advantages of this, obviously, are many. You don’t need to install anything on your computer, your email is stored somewhere else (so when your computer catches on fire, your email doesn’t go up in flames), you get new features as they become available without installing anything and you can use the service from anywhere in the world. I could keep going. Needless to say, this design is great for certain things.
We’re taking the same model for RoastLog. We’ll walk through the steps that your data will take, going from left to right.
- A thermocouple installed in your roaster measures temperature
- The RoastLog data bridge (custom circuit board) plugs into the thermocouple on one side, and a USB cable on the other side
- The RoastLogger desktop application talks to the Data Bridge via USB, pulling in temperature measurements from the TC.
- When you’re done with a roast, you “save” it, which really uploads that roast to the website
- Once you upload a roast, you have access to it from any computer connected to the internet
Of course, there’s much more detail than that. The main idea is that you have tons you’re collecting and managing. We’re providing you with a tool to make that job easier.
Going back to our email analogy, we’re just slightly different since we’ve introduced a piece of hardware (the Data Bridge) plus some desktop software you install on your computer (the RoastLogger desktop app), but the take home message is that roastlog.com will be the mothership. The desktop application checks in with the website to synchronize your data, so when you’re preparing a batch of roasts it knows which beans you have in your inventory, if you want to use Celcius or Fahrenheit, or even who you are once you’ve logged in.
We’re focusing on three primary areas for the SCAA show in April:
- Basic bean inventory management
- Tracking of roasts
- Cupping
Data is great, but it really comes down to interpreting that data. After you’ve logged a roast, you can pull up the history and attach a cupping note. Next year, when you get that new crop of Brazilians in, you’ll be able to pull up your history and see which variables and profile you used for your favorite roasts.
Again, I’ve skipped a lot of detail. But, this should give you a good idea of the major features, and hopefully how you’ll be able to use it in your own roasting operation. The only real requirements for RoastLog are:
- A computer (Mac or PC)
- The internet
- Type-K thermocouple
As always, feedback is always welcome!

2 Comments
Jim · February 3, 2010 at 5:26 am
Can I just feed you a 0-5VDC analog input and do my own engineering scale?
brianz · February 3, 2010 at 6:15 pm
That won’t work. The board reads TC voltage which is in the millivolt range, and our software communicates with the board via our own protocol.
Comments are closed.