I’m excited to be writing about some very cool new features in our latest version of RoastLogger, our client application which roasters use to log hundreds of roasts each day all over the world.
Roast Profile Translation / Zoom at Temperature
If you’ve followed @RoastLog on Twitter, you may have seen me mention “Roast Profile Translation” more than a few times. We learned about this idea from @N3Roaster on his YouTube channel, where he explicitly mentioned that he hoped other profiling software would incorporate this idea. I recommend watching his video but, if you don’t, the synopsis is: Coffee roasted with the same profile *after* a certain time/temperature produces the same results regardless of what the roasting profile looked like *before* that point.
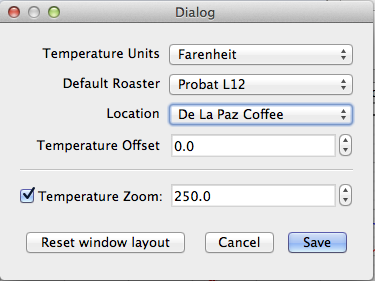
In RoastLogger 2.3, what you now can do is set a temperature at which you’d like your background profile and current profile translated (I’ll use “zooming-at-temperature” and “Temperature zoom” interchangeably with “translation,” although our feature is implemented a bit differently than Typica‘s).
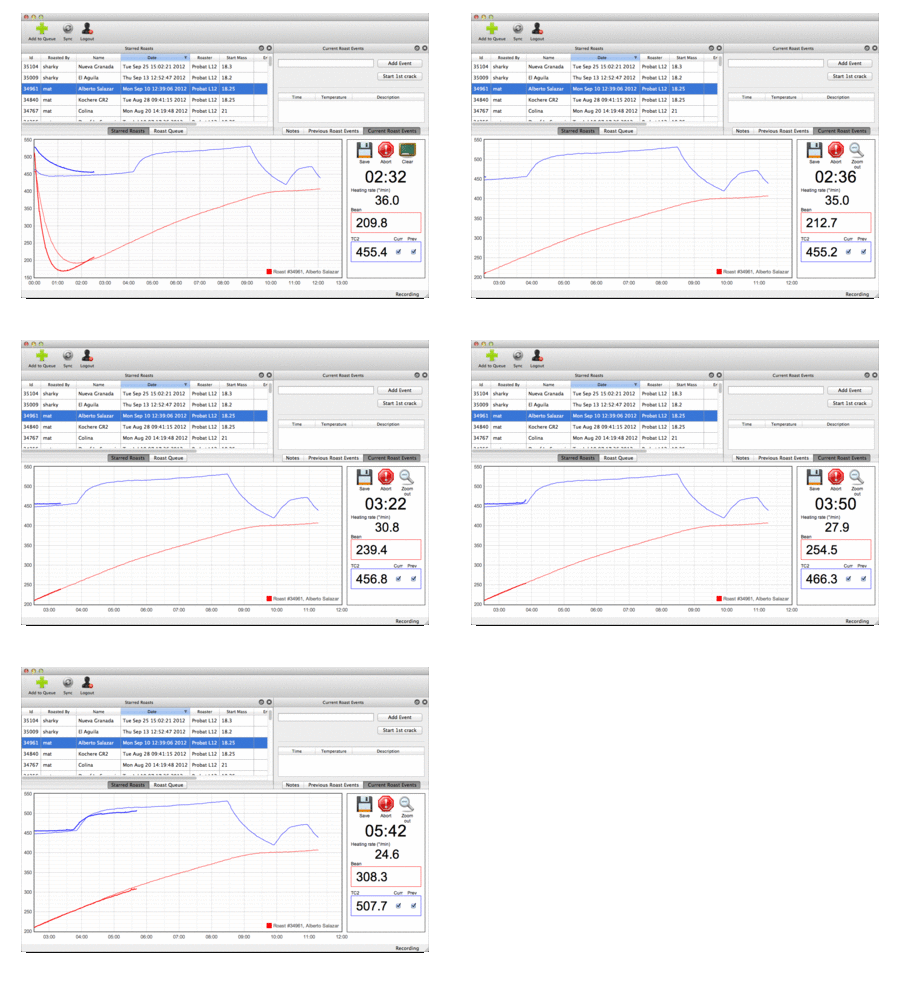
Here’s what will happen if you have this feature enabled, provided you have a profile in the background. Assume you have a set point of 250°F, and that you hit that temperature at 9:00 (nine minutes exactly).
- The plot will be zoomed in such that the starting point on the x-axis is 9:00. This will be the minimum value.
- The background profile will be shifted forward or backward (“translated”) such that its starting value is 250°F.
- The plot’s maximum value will simply accommodate the background profile.
- The current profile will continue to be drawn as the roast progresses past 9:00.

A simple animation showing the zoom-to-temperature in effect. In this animation, the zoom value was 210. After 210F is hit, the chart is zoomed, two profiles are aligned and profiling continues. It’s always possible to zoom out to get the full picture again.
To translate the background profile, there are three scenarios:
- The background profile hit 250°F at 9:00 (exactly the same as the current plot…highly unlikely)
- The background profile hit 250°F before 9:00
- The background profile hit 250°F after 9:00
Translation forward or backward results in lining up the charts so that you can compare the actual shape of the profile regardless of the overall time at which these profiles took place. As I mentioned before, and as Neal mentions in his video, the idea is that, if the profiles look exactly the same in the final few minutes of the profile (after chemical change), it doesn’t matter if one roast took 15 minutes and the other 16 minutes. The final minutes have the biggest impact. I’m looking forward to hearing what our users do with this feature. It has been useful for Neal, so my guess is that it will be useful for other roasters. I’d also like to thank Neal for publishing this video and encouraging its adoption in other software system like ours.
Logging temperature buckets
Another significant feature in this release is what I’m calling temperature buckets. We’ve had a few requests for data concerning how long a roaster has been “on”:
- How long was my roaster roasting coffee between two dates?
- How long was my roaster running (“on”) between two dates?
- How many hours has the Jim Bob Roaster spent roasting coffee?
Now, when you have RoastLogger running, it will keep track of all this data and periodically radio the information to roastlog.com. Provided your roaster is at 122°F (50°C) or above, RoastLogger will keep track of how long your roaster was in a particular temperature range. All you need to do is to make sure that RoastLogger is running and that you’re logged in. RoastLogger will take care of the rest, behind the scenes. There is going to be some *really* useful data coming from this feature, and I suspect users will appreciate and benefit from seeing what their machines are doing as a function of time.
*Note, I still need to build the front-end component so users can run this report, but getting the data here is the first and most complicated step.
Typical updates
There are some other updates and bug fixes in this release which simply make RoastLogger better…minor changes, bug fixes, etc.
Users can download these in the usual locations:
Mac: http://downloads.roastlog.com/RoastLogger-2.3.0.dmg
PC: http://downloads.roastlog.com/RoastLoggerSetup-2.3.0.exe

2 Comments
Neal Wilson · December 5, 2012 at 9:11 am
Hi, this is Neal. First I’d like to confirm for readers here that I’m happy that the RoastLog team has chosen to bring in a roast profile translation feature. This sort of profile analysis is something that I first wrote about years before I started work on Typica and I’m thrilled that there are now two options available for people who want to be able to use this technique live during a roast.
For the RoastLog devs, I do have one minor suggestion. Perhaps you’ve already solved it in some other clever way that was not made clear (in which case, please disregard this), but your current approach to this feature seems to be the way my first unreleased attempt at the feature was implemented. There were some usability issues that prevented me from making the feature available in that form. In particular, during the first few seconds after translation it is difficult to gauge the slope of the current profile against the target profile. Having at least some of the data from before the translation point available would make this feature much easier to use.
brianz · December 5, 2012 at 9:01 pm
Thanks for the comment and feedback Neal (BTW, I fixed my misspelling of your name in the post!)….and again, a personal thanks for publishing and encouraging the use of profile translation. We don’t add things into our software unless we see value in them, and we clearly see that there is some big value in this feature.
Nice catch in our implementation…we do indeed zoom in directly to the location where the translation temperature has been set, without any buffer. I’d be pretty easy to add some buffer in there so that the x-axis starts at ~30-60 seconds before the zoom temp so perhaps I’ll tweak that.
Comments are closed.